
US Extreme Weather and Climate Change Dashboard
The Continental US Right Now
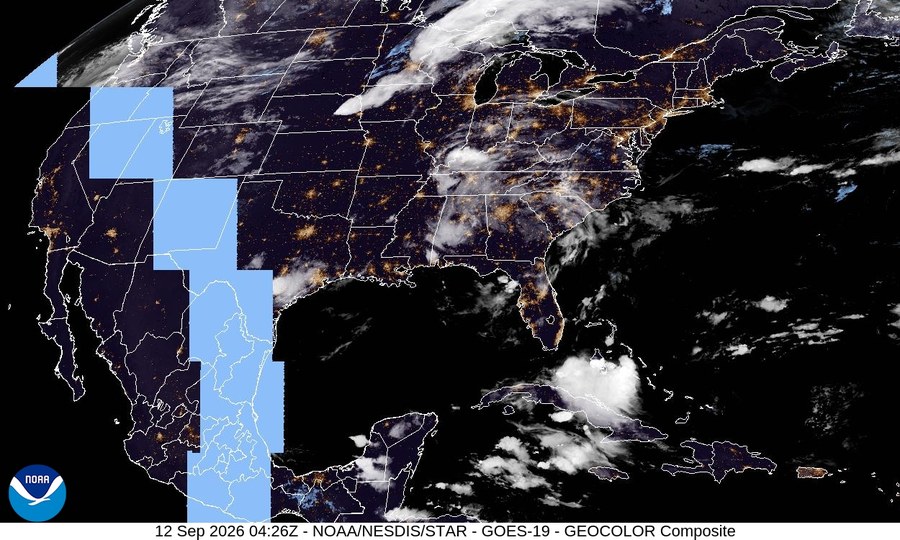
The THB US Extreme Weather and Climate Change Dashboard follows the Intergovernmental Panel on Climate Change's (IPCC) framework for detecting a change in climate in the context of internal variability. This dashboard tracks 39 variables associated with 8 types of extremes: heat waves, cold extremes, tornadoes, flooding, drought, winter storms, wildfire, and hurricanes. The site presents data for the full range of data judged to be of sufficient quality for trend analysis, and on each page for each phenomena, users can choose the time frame over which to observe the data. This is ongoing work in progress – Suggestions welcome!
2026 As Of September 12, 2026
Detection of Long-Term Change
Definitions of the Intergovernmental Panel on Climate Change (IPCC)
- Climate
- "The average weather, or more rigorously, the statistical description in terms of the mean and variability of relevant quantities over a period of time ranging from months to thousands or millions of years."
- Climate change
- "A change in the state of the climate that can be identified (e.g., by using statistical tests) by changes in the mean and/or the variability of its properties, and that persists for an extended period, typically decades or longer."
- Detection
- "The process of demonstrating that climate or a system affected by climate has changed in some defined statistical sense, without providing a reason for that change. An identified change is detected in observations if its likelihood of occurrence by chance due to internal variability alone is determined to be small, for example, <10%."
- Attribution
- "The process of evaluating the relative contributions of multiple causal factors to a change or event with a formal assessment of confidence." This dashboard performs detection only — it does not attempt attribution, which requires separate causal/model-based analysis this project hasn't undertaken.
IPCC, Glossary (AR5/AR6/SR15), "Detection and Attribution."
Detecting a change in climate is not the same as spotting a trend in a time series — it's demonstrating that a trend is unlikely to have arisen from natural internal variability by chance alone. Here that means two things: First, detecting a trend at IPCC's stated example threshold of below 10% (via the nonparametric Mann-Kendall test). Second, because a long, low-noise record can show a statistically significant trend as a result of internal variability, this dashboard adds another check before identifying a detected change: the trend's magnitude must also be a meaningful share (this site's threshold: at least 25%) of the variable's historical variability. A trend can be identified in a time series and still not count as a detected change here for that reason: flooding's trend, for example, is statistically real (p=0.011) but is only about 4% of its typical week-to-week range, and not at all unexpected. This combined standard — IPCC's likelihood criterion plus this site's magnitude check on trends — is what "detected change" means.
Each tile above shows a variable's reliable-trend-window data at a glance and its detected-change verdict — click through to that variable's phenomenon page for the full interactive chart, an adjustable time window, PNG/CSV downloads, and alternative metrics. Full definitions and caveats are documented on the Methodology page. A side-by-side comparison of how IPCC AR6 has characterized each hazard, and how it compares to this site's findings, can be found on the Detection & Attribution page. Every variable this site tracks, including the ones without their own tile above, is listed on the Every Variable page.